
Your next Exc Dataviz bootcamp starts soon
JOIN OUR NEXT DEDICATED EXCEL BOOTCAMP00
DAYS
00
HOURS
00
MINS
00
SECONDS
Excel is more powerful at dataviz than you might think
So few Excel users know just how deep, powerful and flexible the tool is for building data visualisation
Don't feel like "Excel is just the tool I have to use" - embrace it
Our next bootcamp dates
May 4th 2026
Our very first Excel Dataviz bootcamp starts officially on Monday 4th May and lasts for 8 weeks.
Intimate Small Cohort Bootcamps
This bootcamp starts March 2nd 2026 and last 8 weeks.
- Maximum 12 folks in your cohort
- Weekly live sessions for all questions
- Over 20h of live sessions with your coach Charlotte Hadley
- Additional fortnightly "no-code" dataviz office hours
- Five assignments with video feedback (inc. code!)
- Each week has two learning streams: dataviz and R
- Over 20h of custom on-demand training with life time access
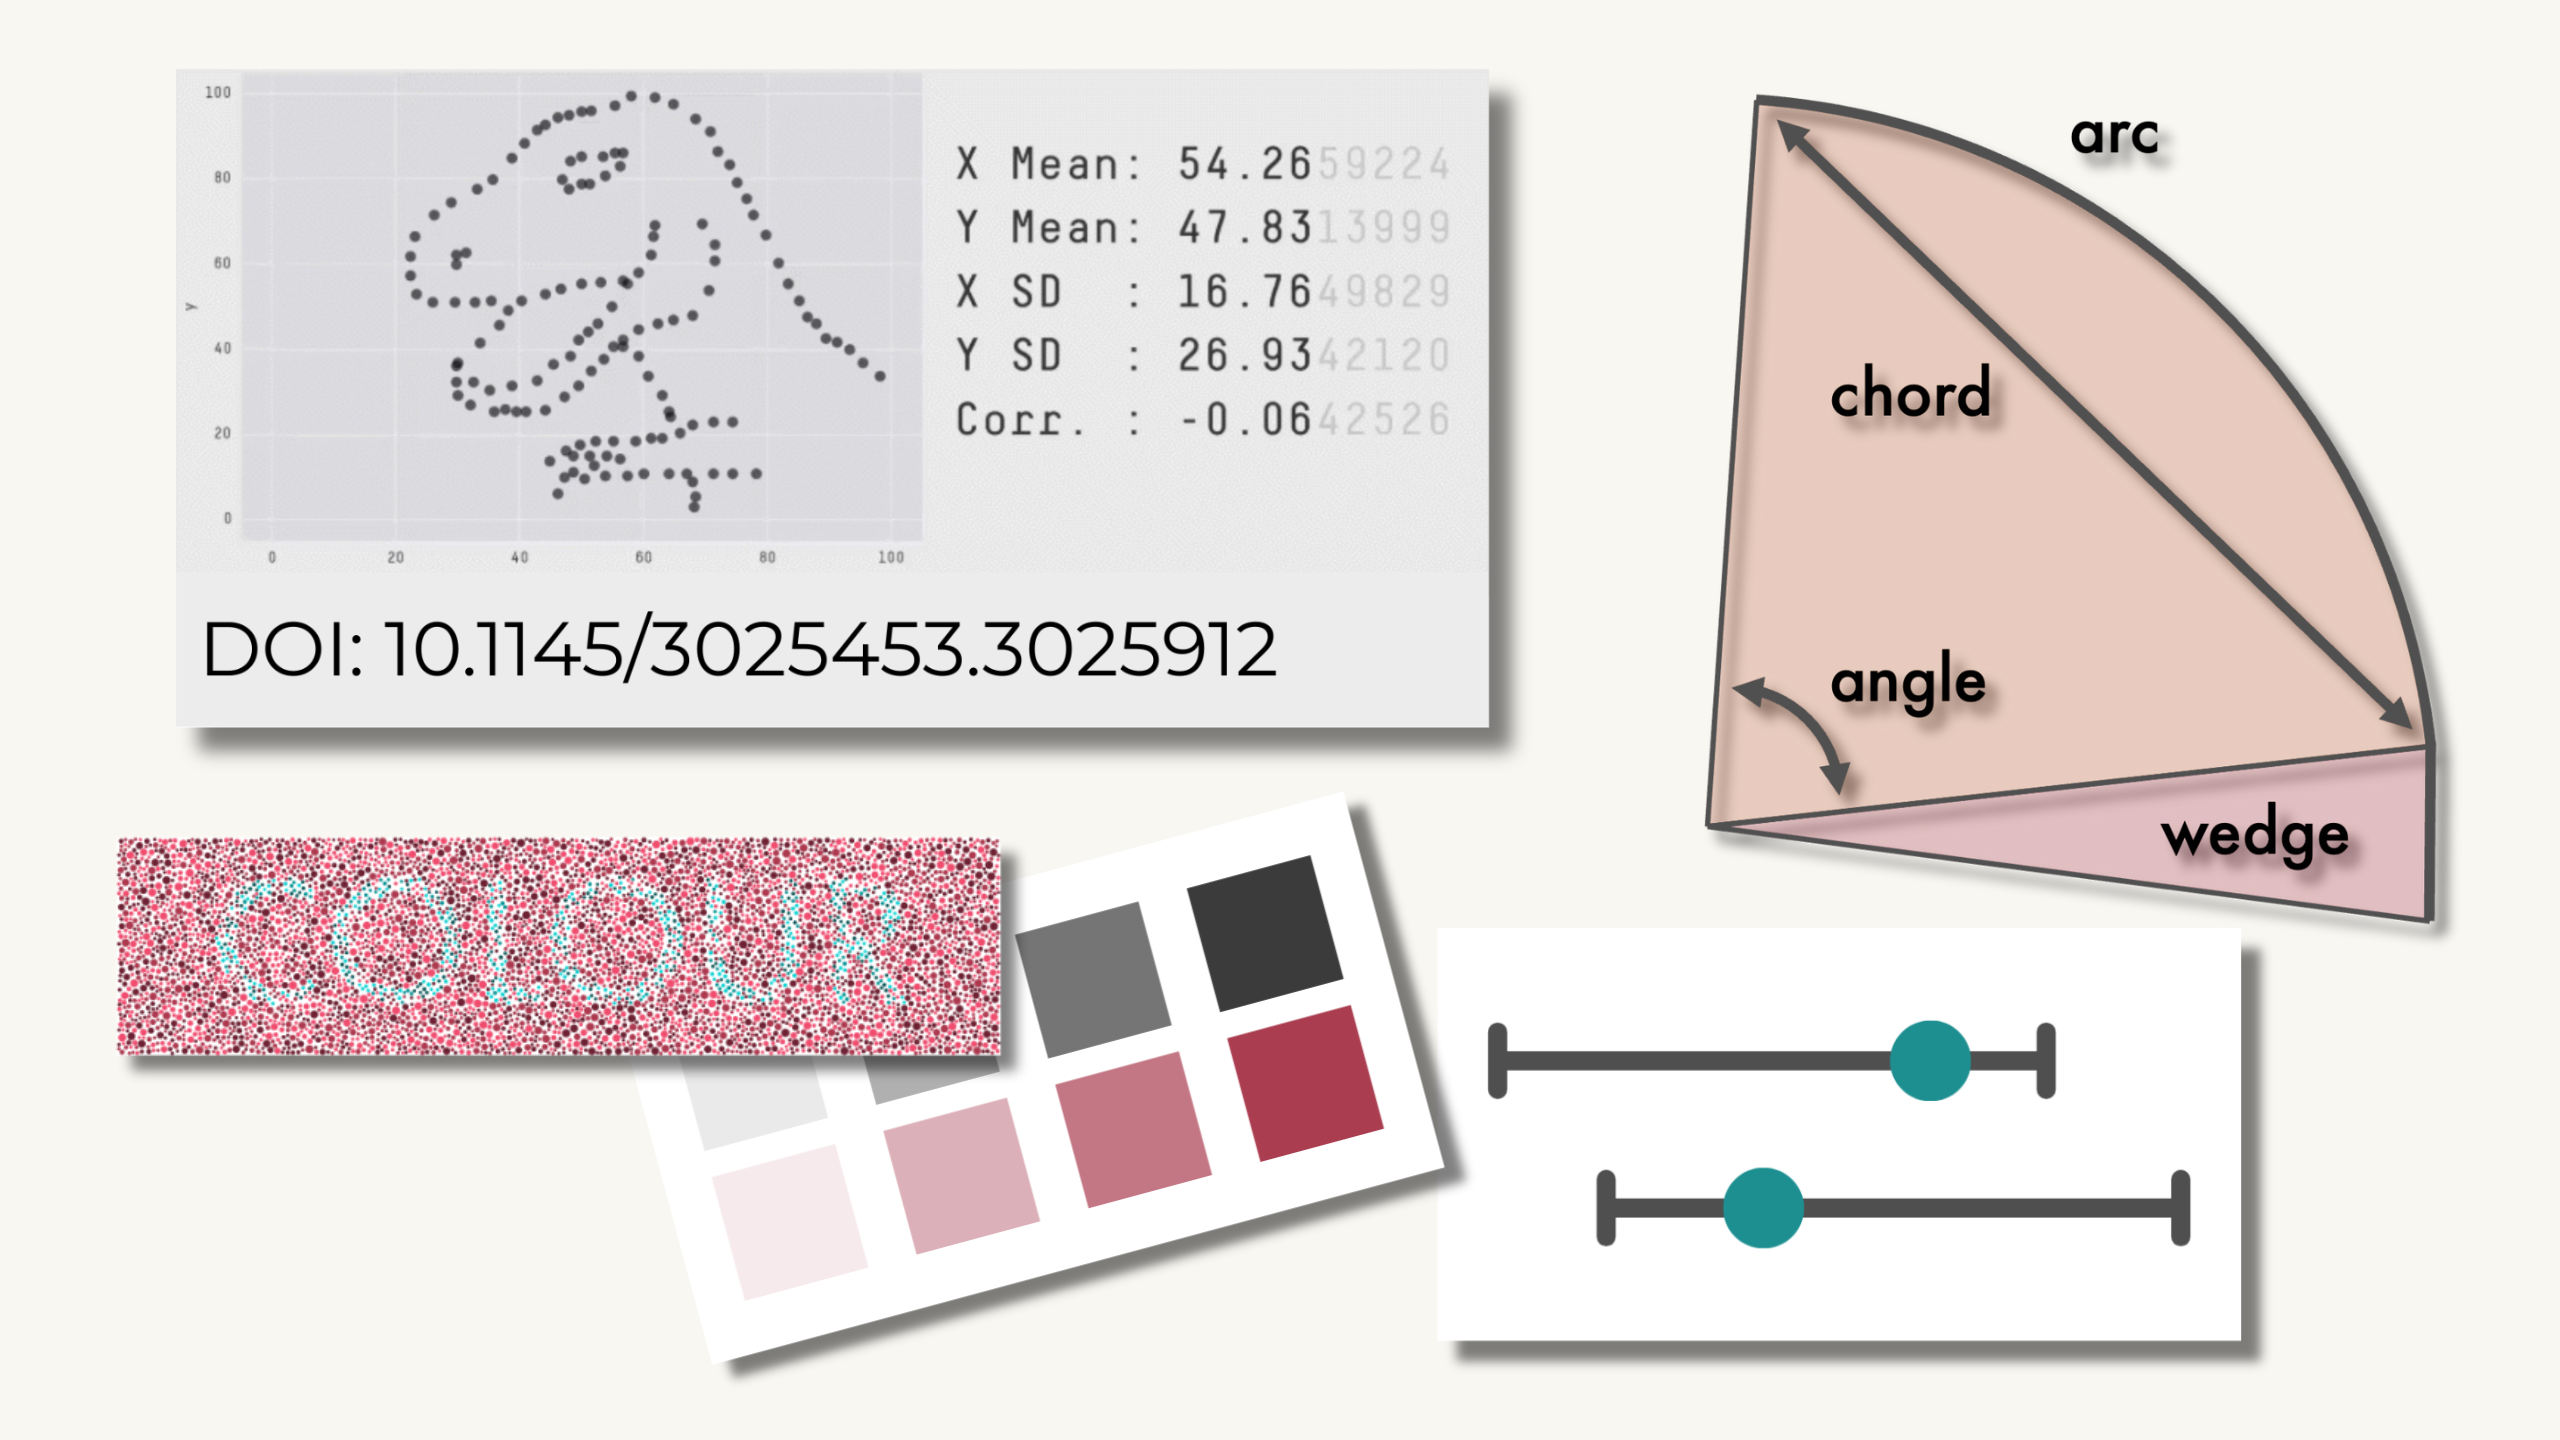
Dataviz Theory
Fundamental quantitative research should inform your dataviz at all points. You also need to account for accessibility and data fluency in everything you build.
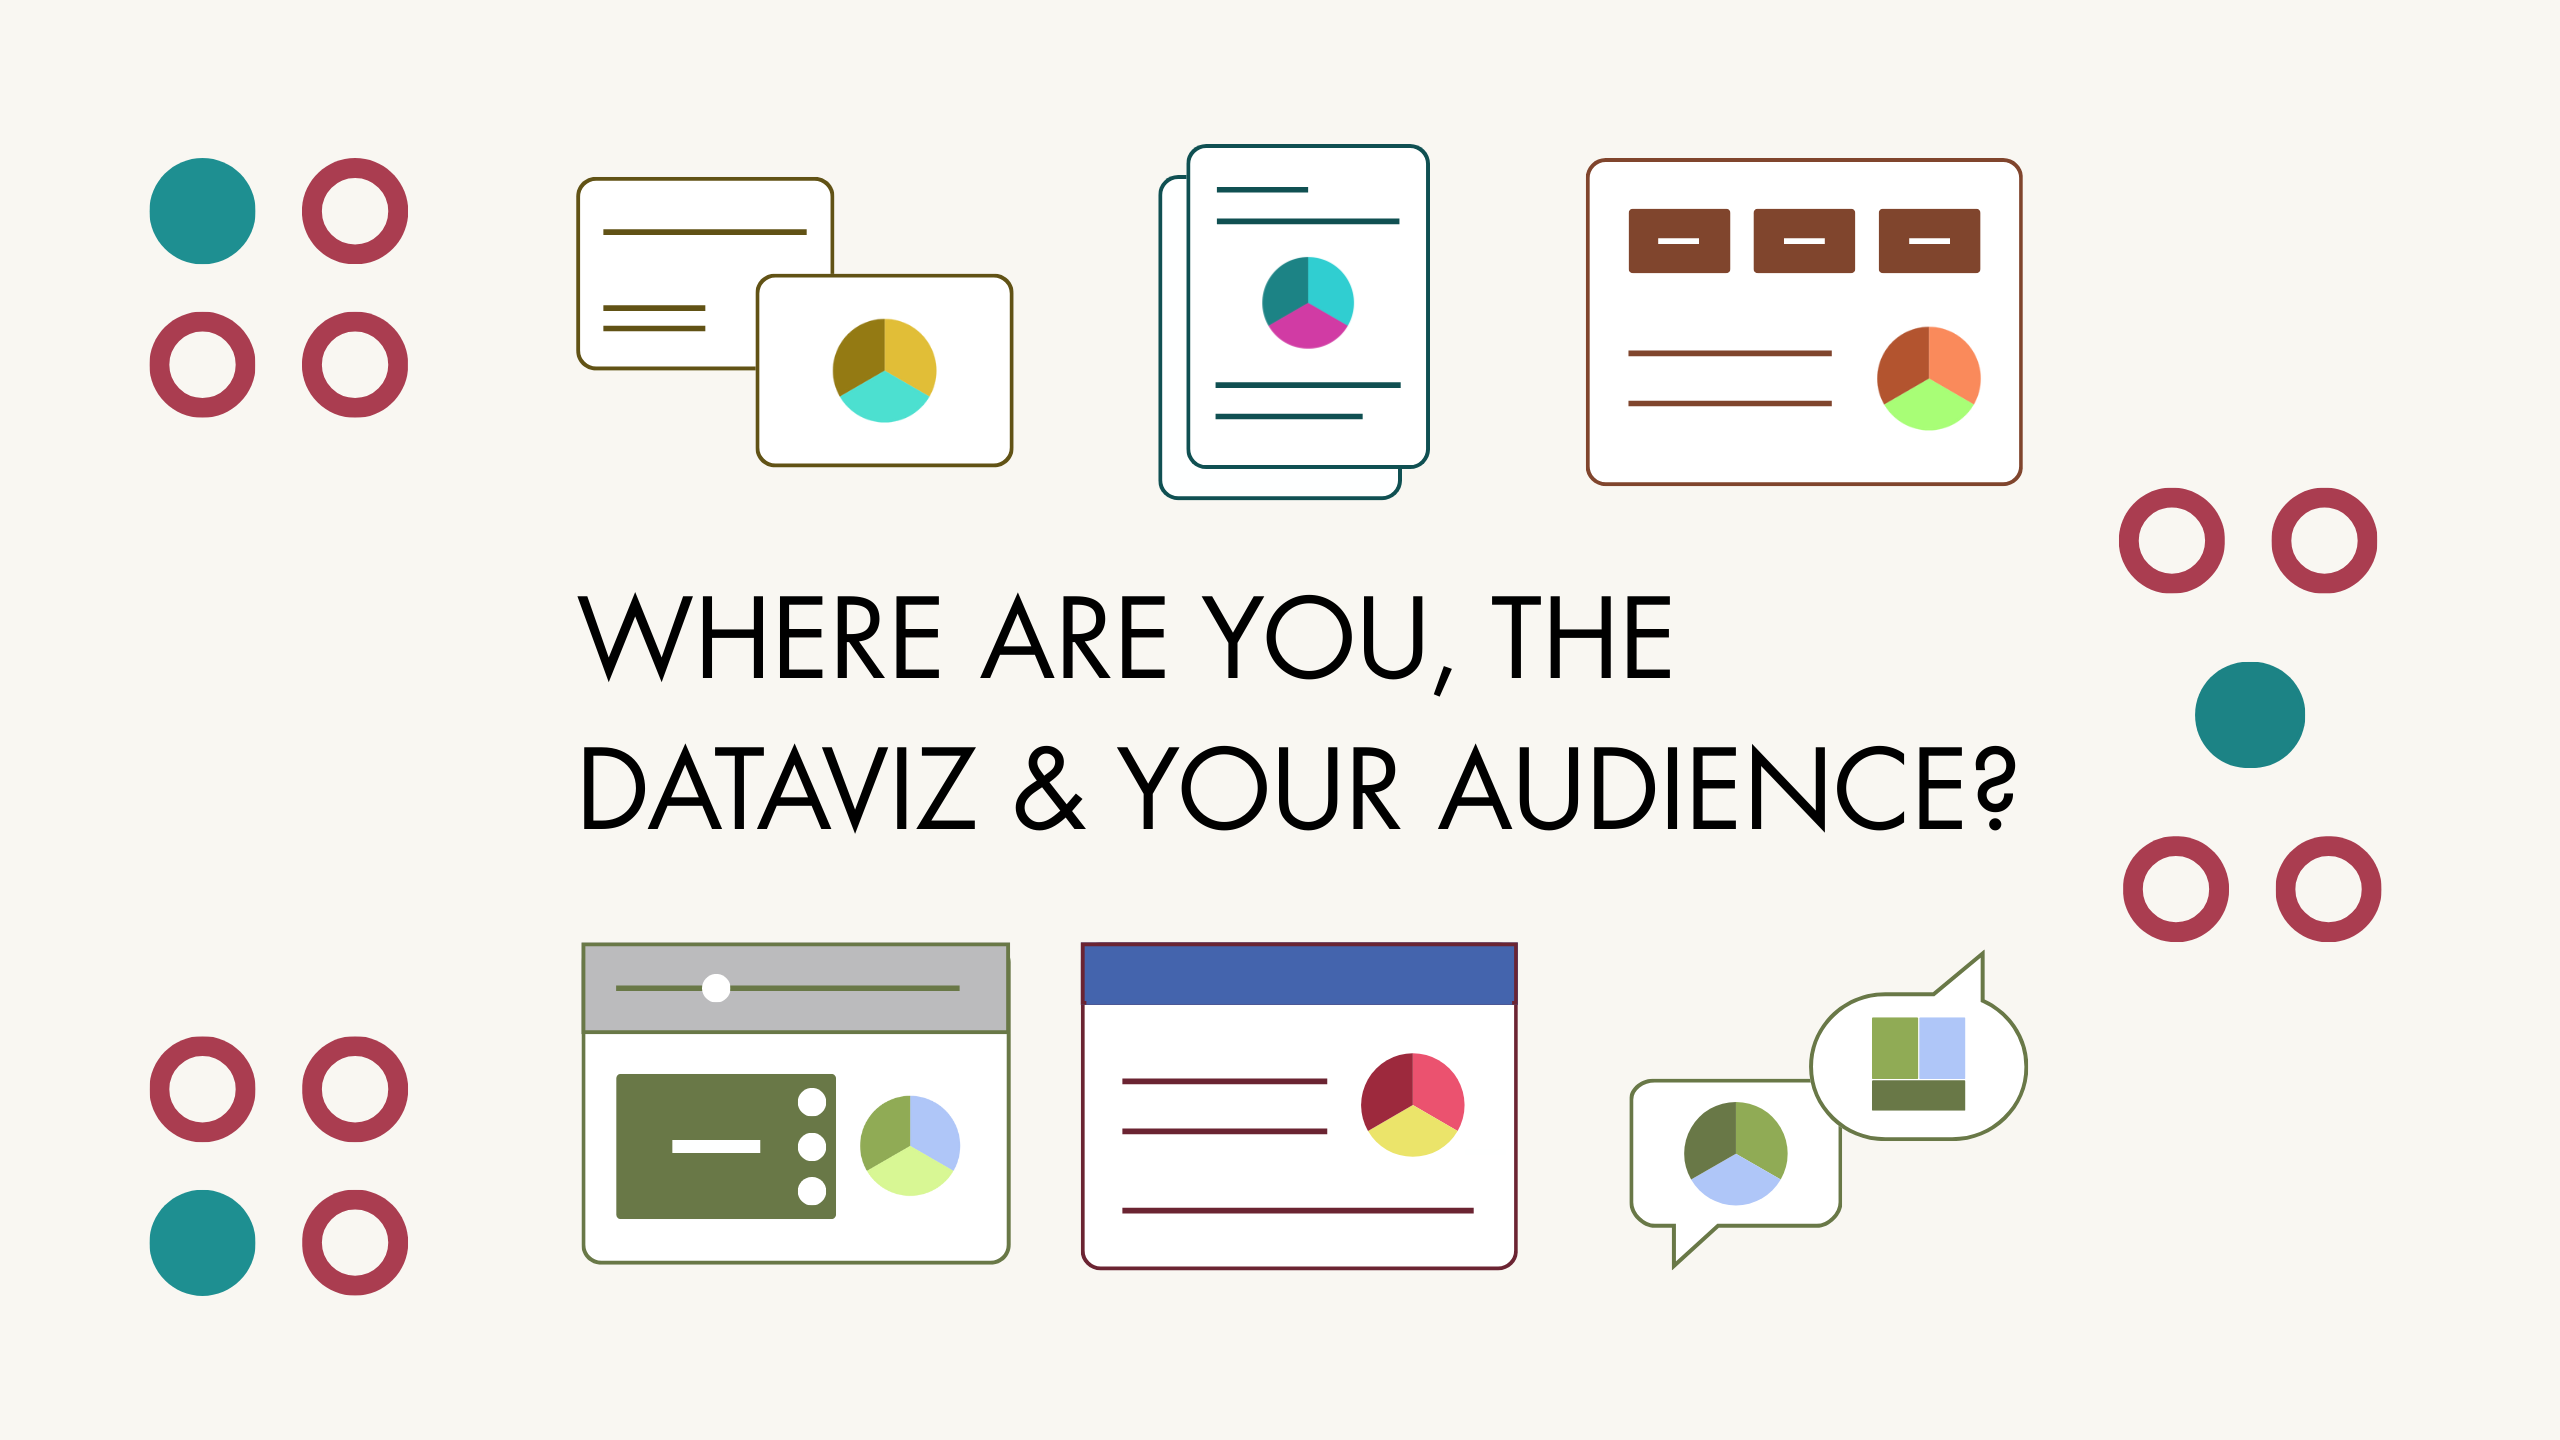
Data Storytelling
Storytelling is more than decluttering & focusing attention. You can't design dashboard, deks and reports the same. Where are you - the storyteller - in your story?
Meet your coach Charlotte
Charlotte Hadley is a passionate data visualisation maker, evangelist and coach. She's also a strong advocate for data ethics and reproducibility.

Dataviz Experience
- Built a Centre of Excellence in dataviz at the UK's largest, FTSE100 insurance company.
- Multiple award winning dataviz creator, including shortlisting in Posit's 2025 Scrollytelling competition.
- Invited speaker and visting lecturer specialising in dataviz.
- Polyglot dataviz tool user, including; R, JavaScript, Excel, Tableau, PowerBI and more.
R Experience
- CRAN package developer and contributor to core tidyverse packages
- {htmlwidget} and Quarto extension author
- Commercially successful Shiny and R consultant.
- Committed and deeply embedded member of the #rstats community. I'm a hawk for updates to News.md and Posit's blog.
Coaching & Instructor Experience
I'm extremely proud of the work I've seen from my students, learners and coachees build. That's really where my passion lives, many have built dataviz and tools that I'd struggle to build myself!
- Proud LinkedIn Learning Instructor with the single most popular R course in the catalogue.
- Lectured in doctoral training centres and masters programs at Oxford University, BCU and AUC
- Built an award-winning data-focused "train the trainer" program in the UK's largest, FTE100 insurer.
- Certified trainer, including: Data Carpentry, Posit Shiny Instructor, Software Carpentry.
Accountability
You're not alone! You're learning and building together with both your cohort and coach in a collaborative, friendly community. Share your thoughts, sketches and code in our safe dataviz + R space.
Feedback
You'll complete 5 assignments using your own data and get custom video feedback with code. There are also micro-assignments within the course everyone can compare as they use public data.
Coaching
Throwing you code doesn't equip you to solve future problems. But coaching does. Charlotte's coaching is consistently highlighted as the high point of every program she's contributed to.
