00
DAYS
00
HOURS
00
MINS
00
SECS
What makes our bootcamps different?
We don't run tool agnostic training for thought leaders. We run tool-specific bootcamps for you - people who have their hands deep in the data and need to explore, understand and communicate.
Tool-specific coaching
Incredible tools for reproducibly and programmatically analysing, visualising and communicating with your data. Fully customisable with an Open Source heart.
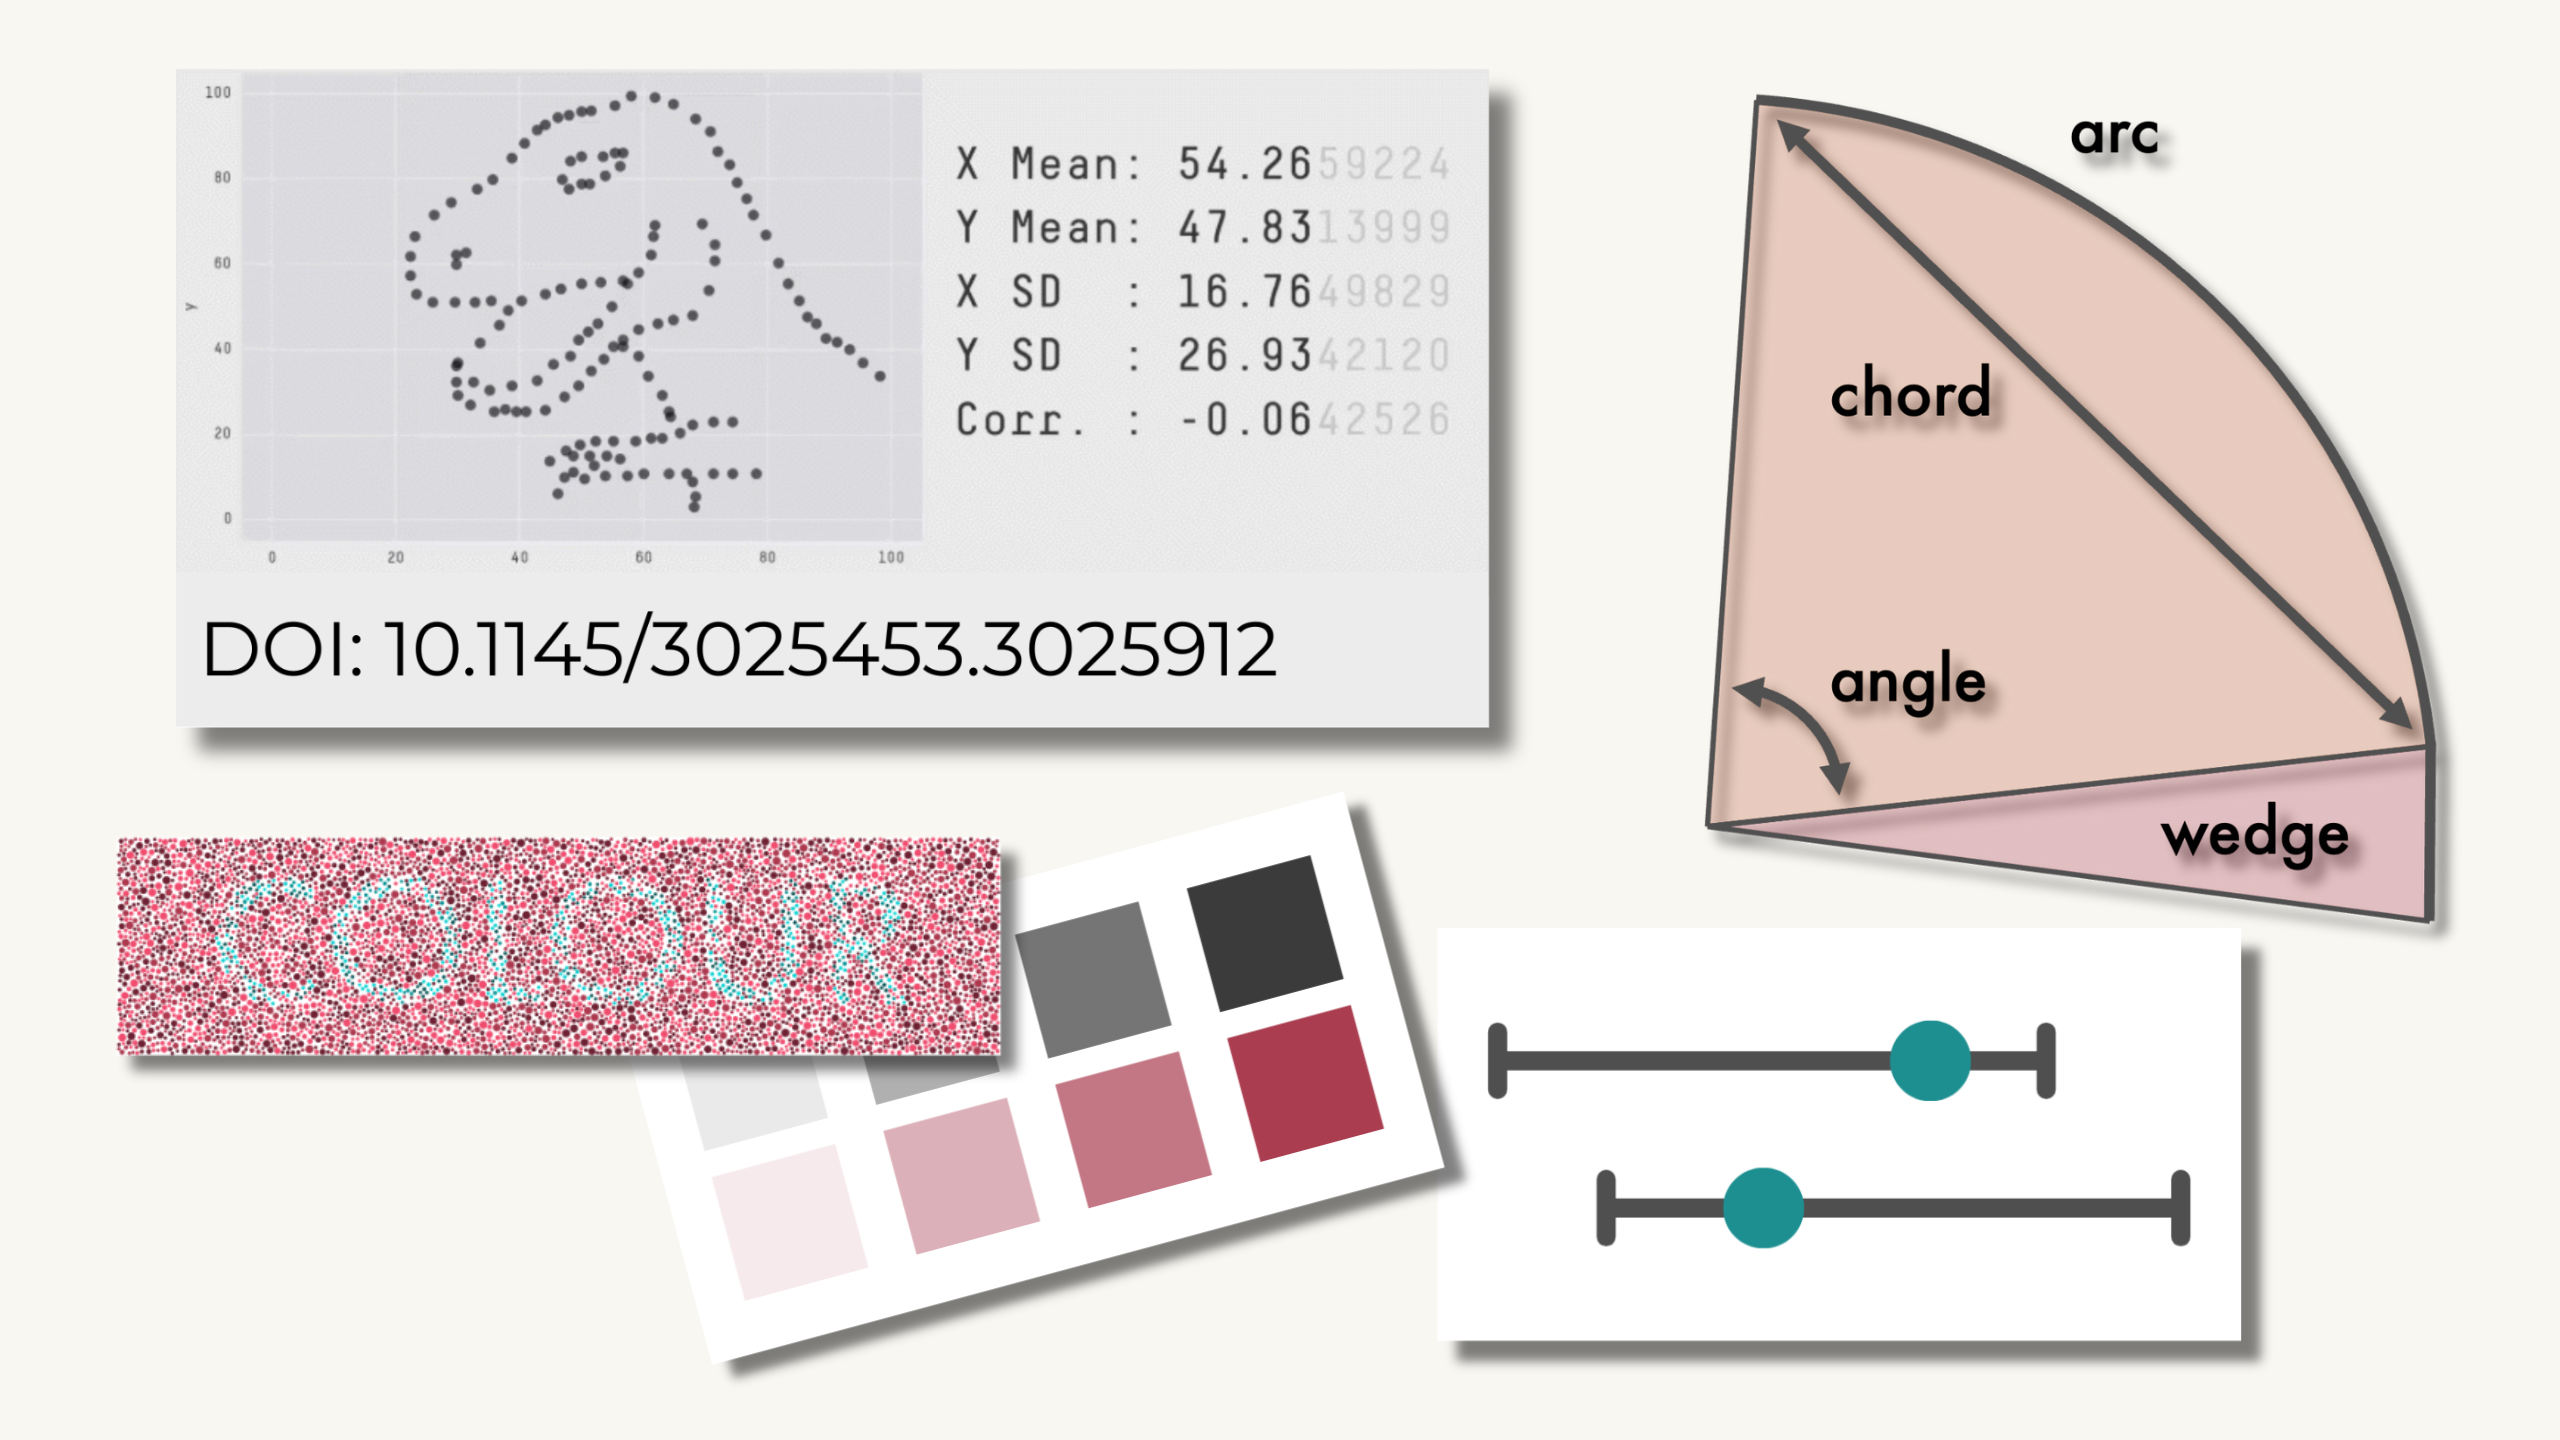
Dataviz Theory
Fundamental quantitative research should inform your dataviz at all points. You also need to account for accessibility and data fluency in everything you build.
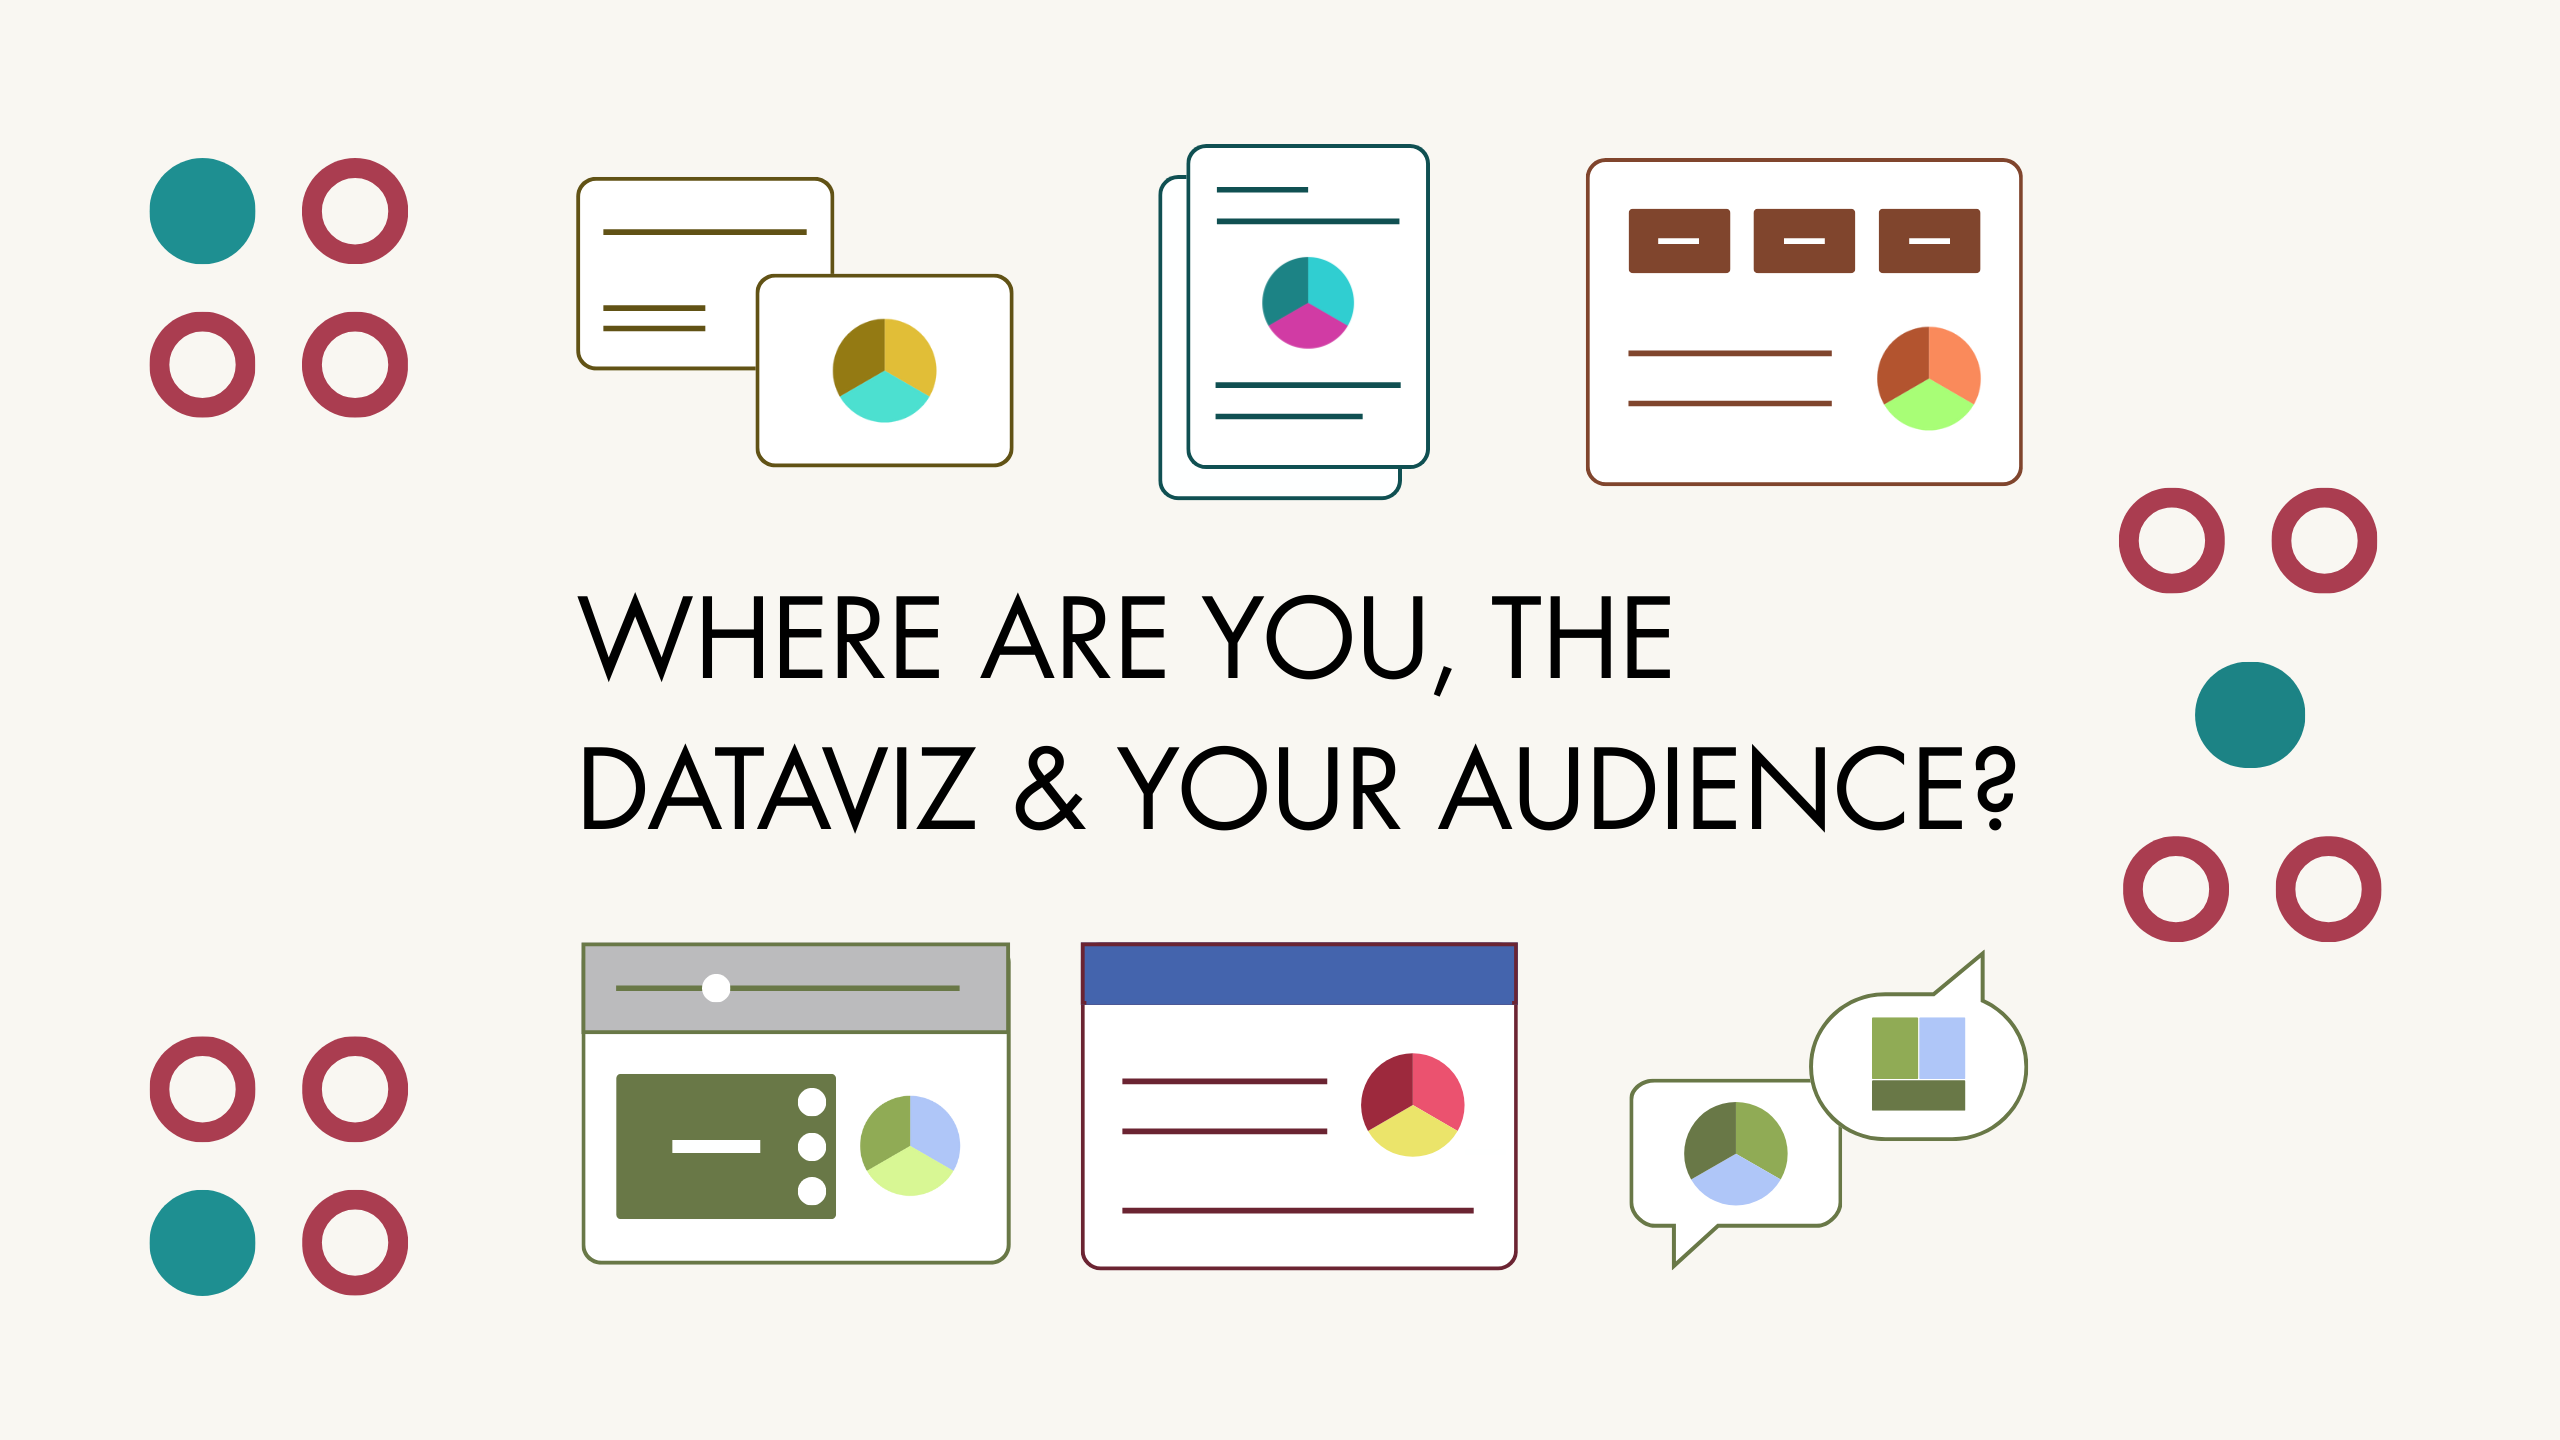
Data Storytelling
Storytelling is more than decluttering & focusing attention. You can't design dashboard, deks and reports the same. Where are you - the storyteller - in your story?
Tools we cover
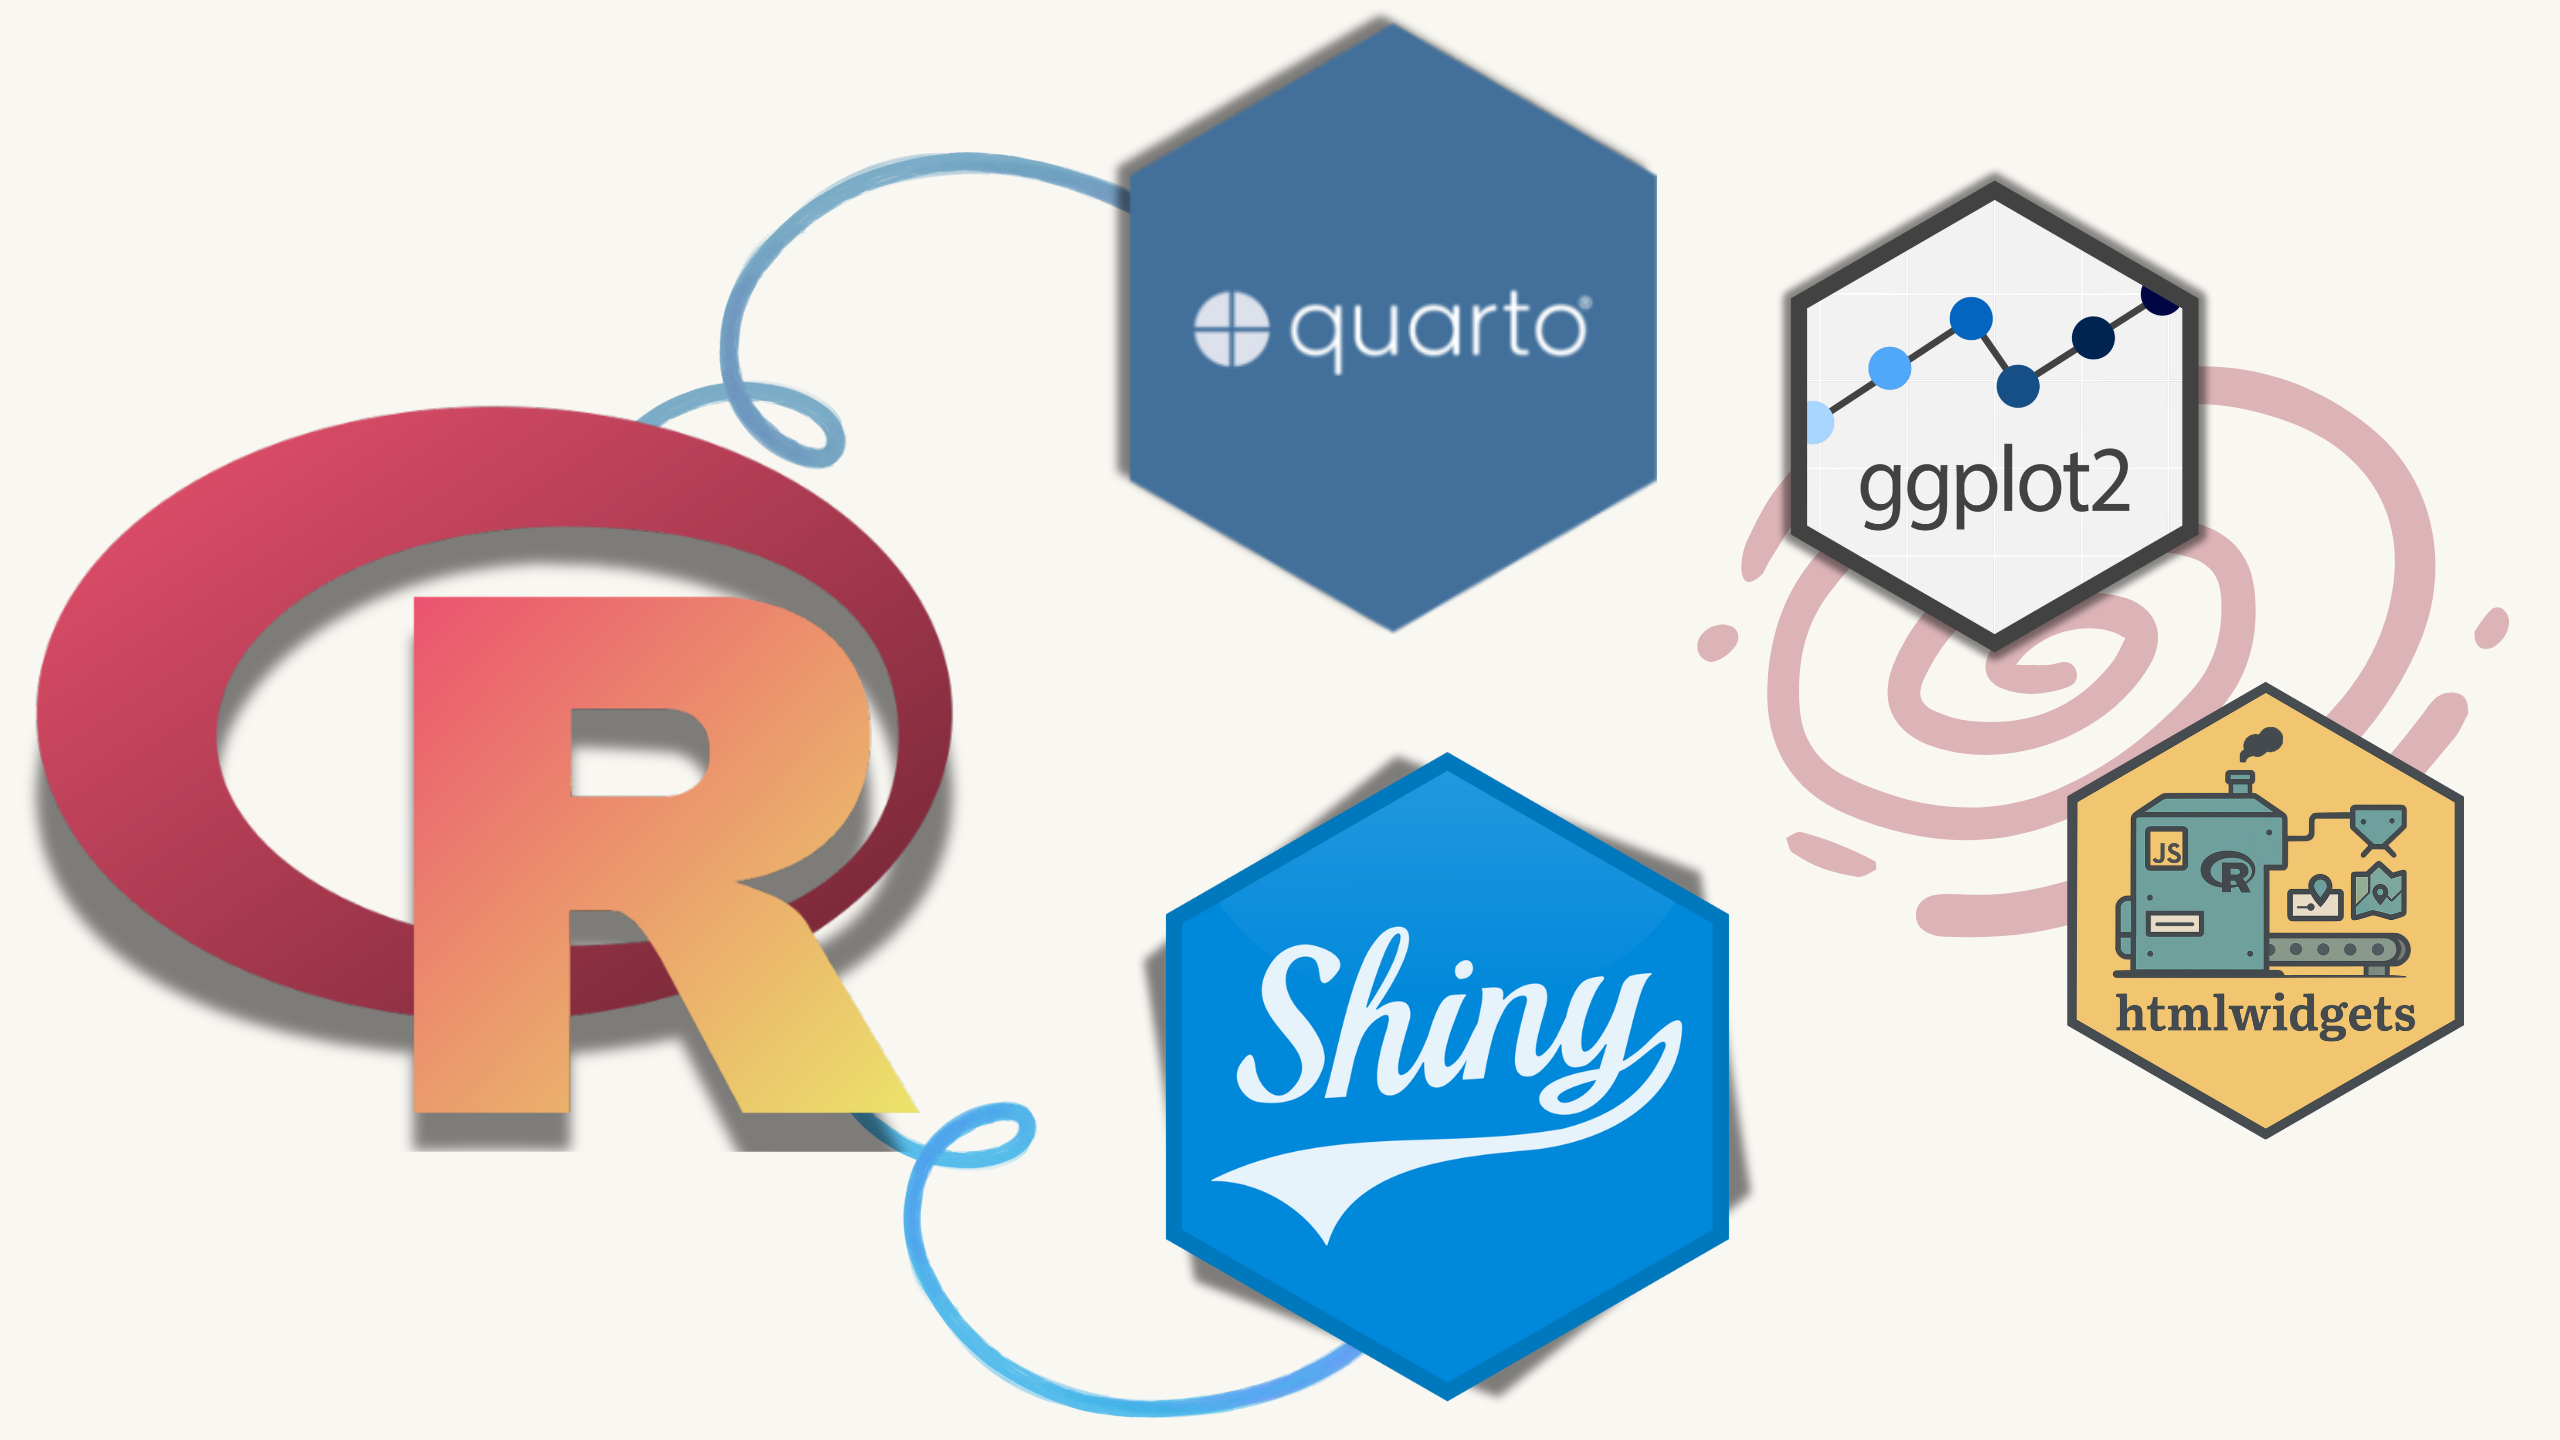
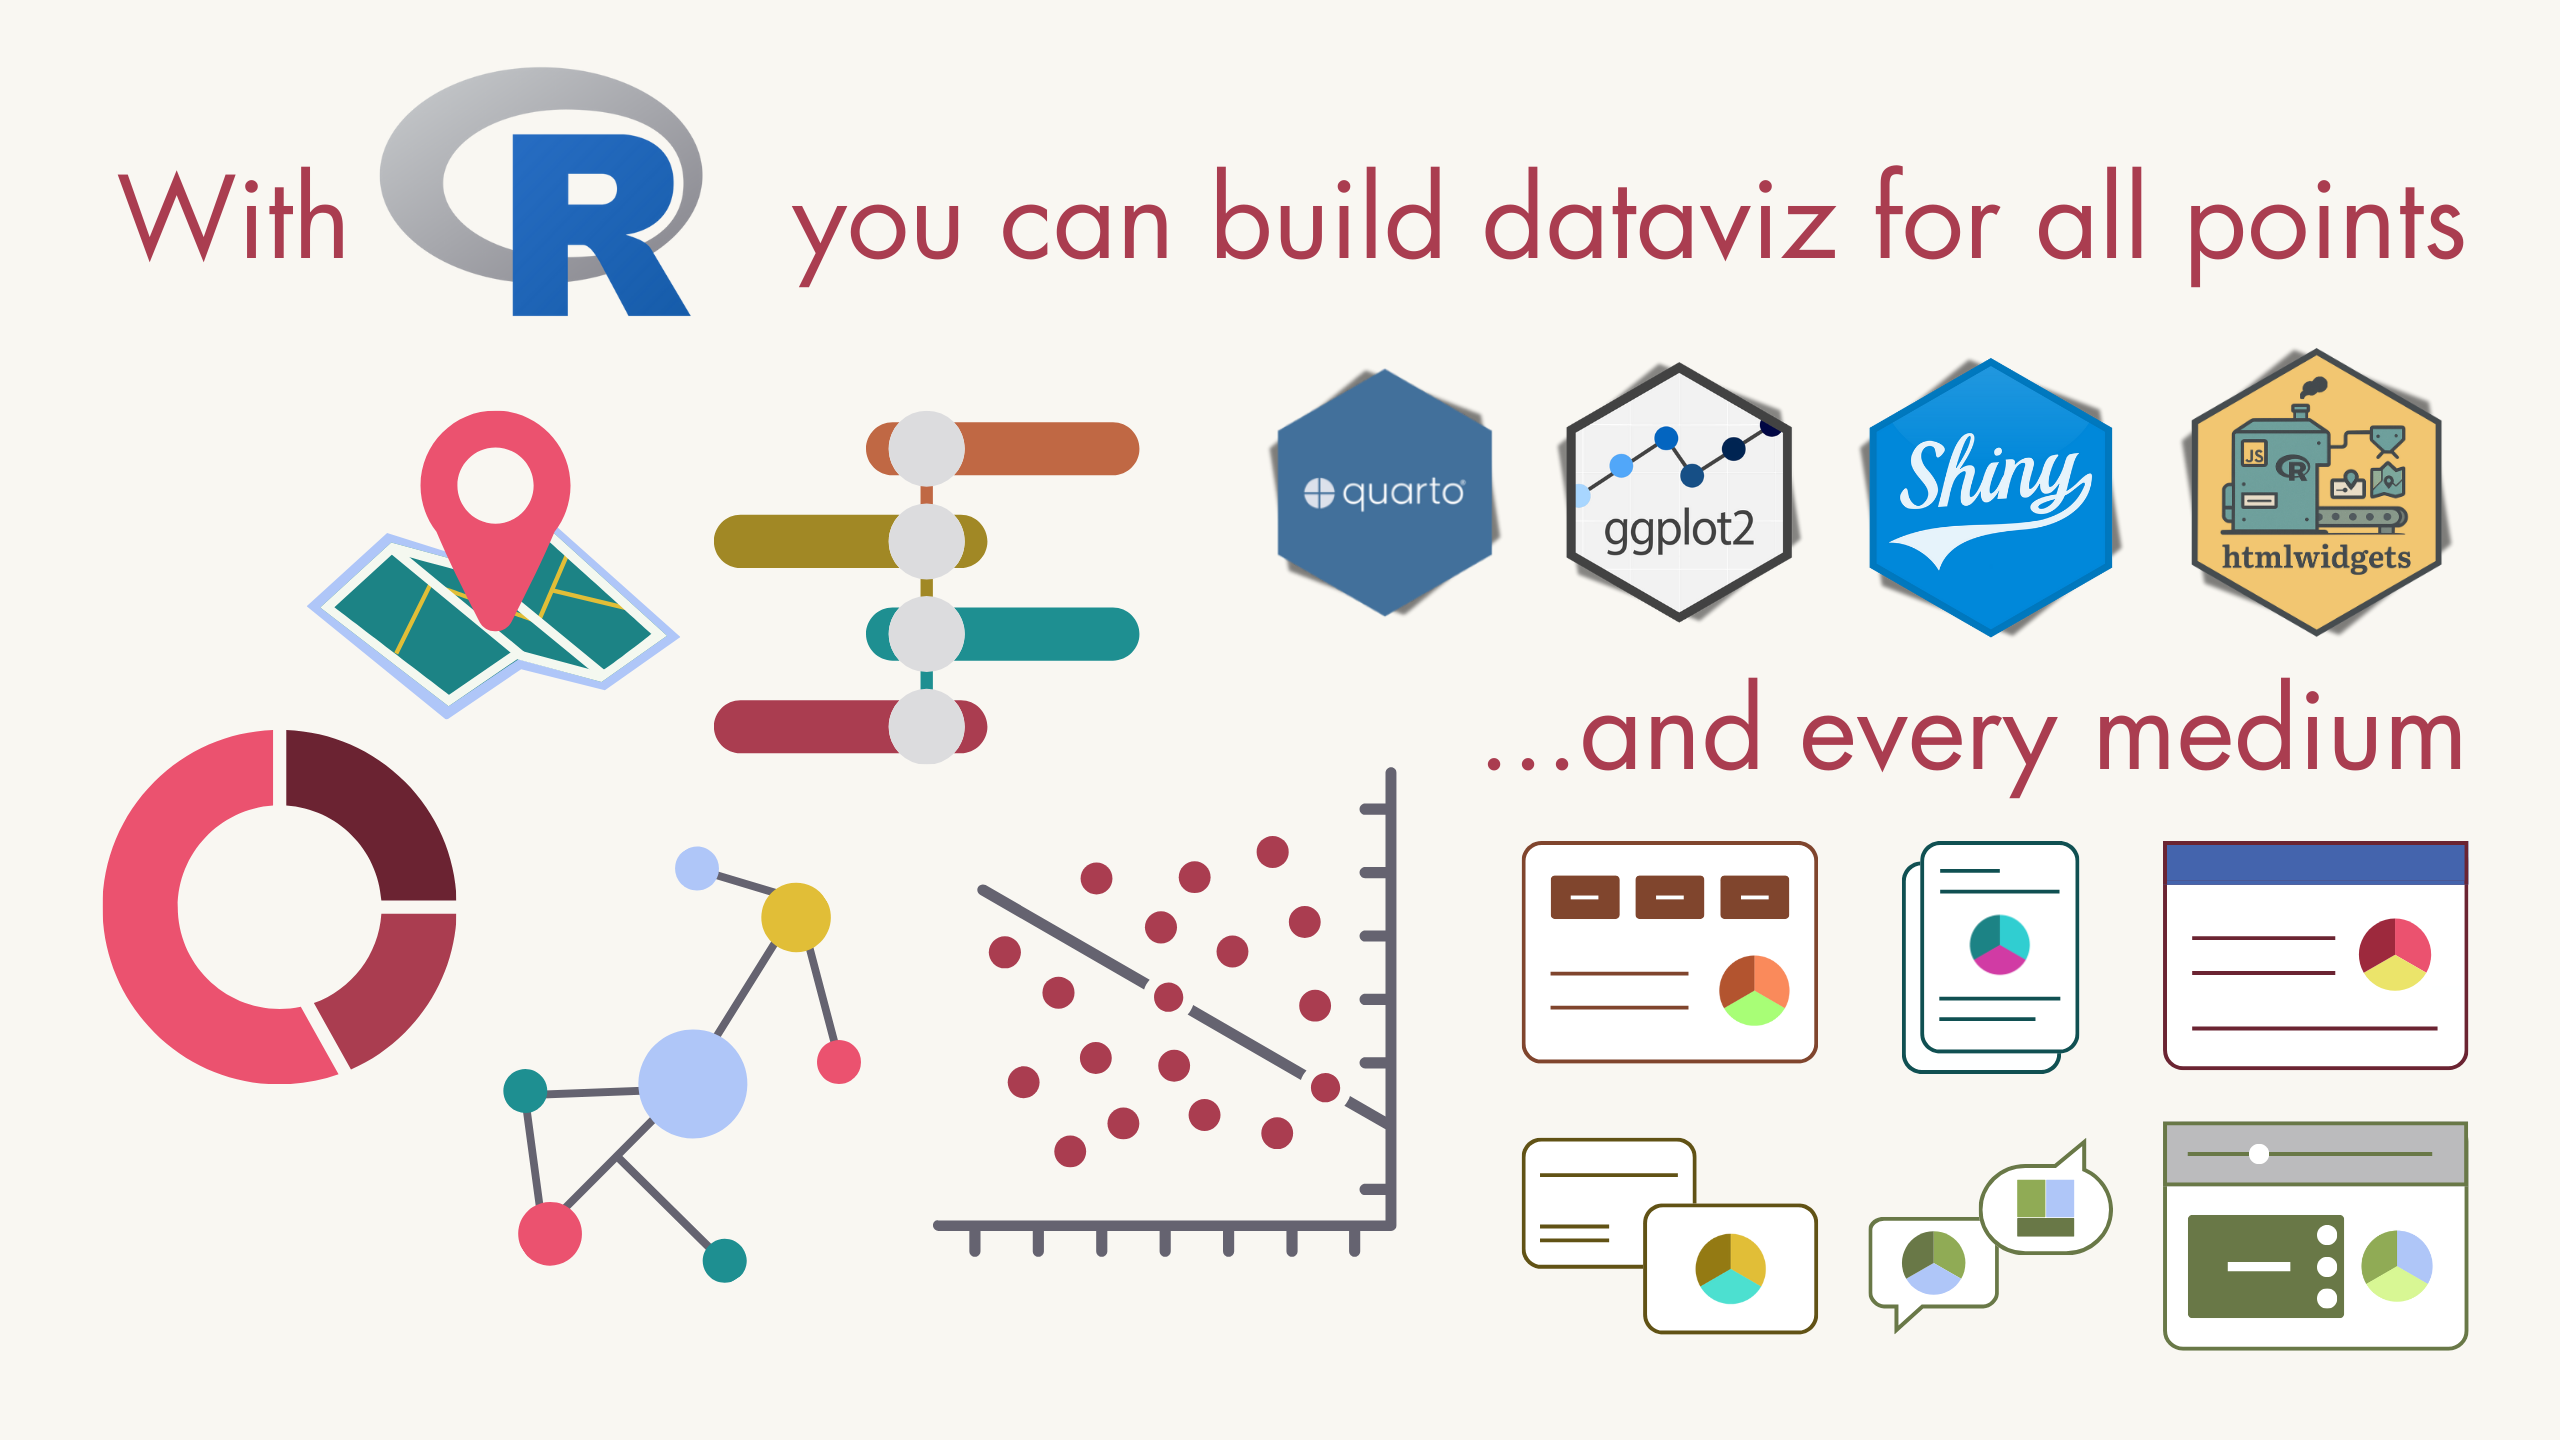
R (ggplot + Quarto + Shiny)
We fundamentally believe if you can choose your tool, R is the most powerful dataviz ecosystem that exists.
Excel
Excel is so much more powerful, flexible and just BETTER than you might think. Move past "Ugh, I have to use it" to embracing Excel for dataviz.
All of our upcoming bootcamps
Tool-specific coaching
Incredible tools for reproducibly and programmatically analysing, visualising and communicating with your data. Fully customisable with an Open Source heart.
Dataviz Theory
Fundamental quantitative research should inform your dataviz at all points. You also need to account for accessibility and data fluency in everything you build.
Data Storytelling
Storytelling is more than decluttering & focusing attention. You can't design dashboard, deks and reports the same. Where are you - the storyteller - in your story?
